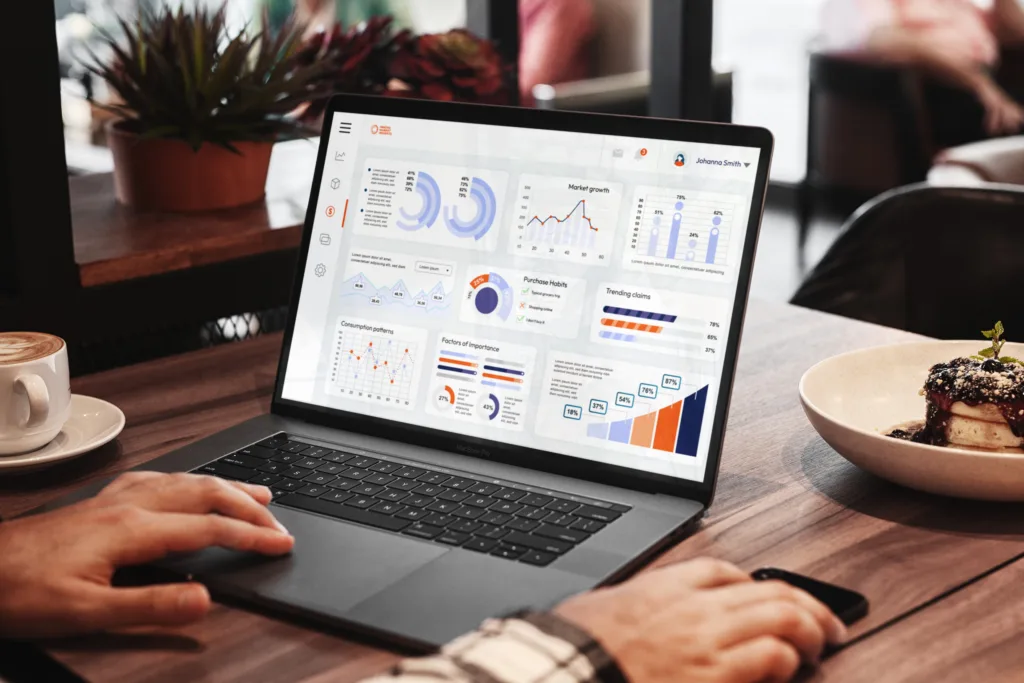
Innova Dashboards add an invaluable resource. It’s just like having an extra analyst on your team; highlighting key insights, providing overviews and offering the option to drill deeper into the data.
Gain 360° insights as our dashboards bring together multiple data points into one place. All this is visualized in charts and infographics that are clear to read and ready for you to use immediately.
Add four geniuses to your team
We call our dashboards “Genius” because they deliver a wealth of knowledge with speed and clarity, bringing data to life.
Category Genius
Distil comprehensive intelligence to allow you to focus on the areas that best fit your product, brand or project.
Consumer Genius
Zoom in on the key insights you need. Draw on Innova’s year-round surveys that capture 35 million consumer datapoints annually.
Ingredient Genius
Open up a world of insights thanks to the thousands of ingredients Innova tracks. From broad trends to current and projected volumes.
Flavor Genius
A fast and complete picture of flavor trends and usage. The full range of flavors tracked to provide comprehensive insights.